Birthday Research Center · Study
What Do Kids Actually Want at Their Birthday Party?
Survey of 4,985 parents · Activity demand vs. theme spending
Overview
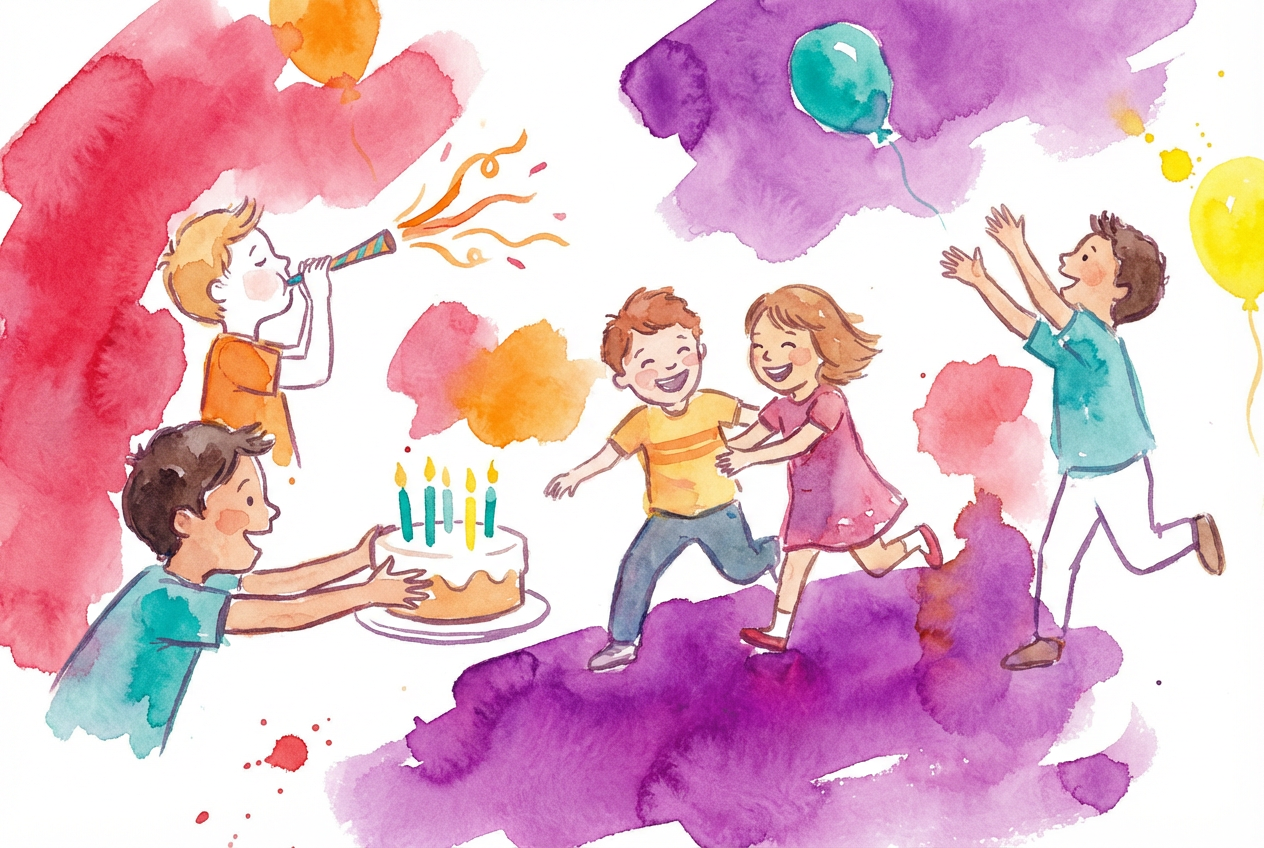
More games and activities — by a wide margin. Only 23% of parents worldwide say a special theme or decorations would help. The number-one answer, across every age group and country: more to do.
When parents in our study were asked what single change would have made their kid's last birthday party better, 34% said more games and activities. Only 23% pointed to a special theme or decorations. The gap shows up everywhere — in every age group, in every country, in every type of family — and it's the most consistent finding across our entire research program.
That gap between what parents spend their planning energy on and what kids actually want is worth paying attention to. The aesthetics get most of the attention; the experience gets less than it should.
This study looks at what specifically would make kids' birthday parties better, broken down by age, by region, by social style, and by parent — including a notable disagreement between moms and dads on what matters most.
Key Findings
- 34% of parents say more games and activities is the #1 birthday party upgrade — the most-cited answer in every age group and country studied.
- 23% say a special theme or decorations would help most — far behind, despite receiving most of parents' planning attention.
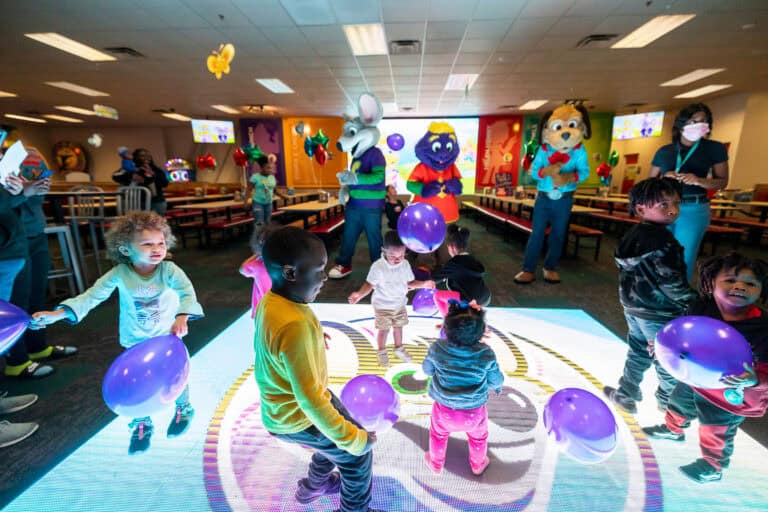
- Among parents who've hosted at Chuck E. Cheese, the activity preference climbs to 42% — the highest of any venue segment.
- For kids ages 10–12, the top upgrade is social: 30% want more friends and family present.
- In Japan, 58% of parents prioritize better food and cake — nearly four times the global average.
- In Guatemala, 45% want a bigger location; in Puerto Rico, 47% want more activities — the highest country-level response for that item.
What would most improve a child's birthday party? (Full results)
The study asked parents of children ages 2–12 to identify the single change that would have made their child's most recent birthday party better. Here are the complete global results, ranked by overall share.
Source: Chuck E. Cheese Birthday Celebration Study, 2026. n=4,985 parents, 25+ countries. Percentages reflect single-answer selection; totals may not sum to 100% due to rounding.
| Improvement | Overall % |
|---|---|
| More games and activities | 34% |
| A special theme or decorations | 23% |
| A different or bigger location | 28% |
| Better food and cake options | 15% |
| More friends and family | 25% |
| A favorite character or performer | 12% |
| More personalized gifts | 16% |
| Longer party time | 15% |
Why does "more fun" beat "more fancy" at every age?
Across the board, 34% of parents said more activities would be the biggest upgrade to their child's next party. Not a better venue. Not better food. Just more things to do.
That priority strengthens among parents who've already hosted at a venue built around activity density: it climbs to 42% among parents who've celebrated a birthday at Chuck E. Cheese. These parents have effectively solved the location question and now optimize for fun-per-minute. They also under-index on themes and decorations (21% vs. 23% overall). It's not that presentation doesn't matter — it's that they've figured out where the real value lies.
Parents who gave their child's last birthday a perfect score were significantly more likely to have prioritized activities and the social experience over aesthetics. Parents who rated the party poorly were more likely to say they wished the food had been better or the party had lasted longer. The best parties aren't the prettiest ones — they're the most fun.
How does venue experience shape birthday priorities?
One of the more revealing data cuts is how birthday improvement priorities shift across the five tiers of Chuck E. Cheese experience — from parents who haven't heard of CEC through those who've hosted a full birthday party there. The pattern is consistent: as families move from awareness to experience, activity preference strengthens and theme/decoration preference softens.
Source: Chuck E. Cheese Birthday Celebration Study, 2026. CEC Segment defined by parents' reported venue experience. Top 5 improvement options shown.
| Improvement | Unaware of CEC | Aware, No Visit | Visited, No Party | Party at Other Venue | Party at CEC |
|---|---|---|---|---|---|
| More games and activities | 29% | 31% | 34% | 36% | 42% |
| Theme or decorations | 26% | 25% | 23% | 22% | 21% |
| Bigger location | 30% | 29% | 27% | 26% | 22% |
| More friends and family | 22% | 24% | 25% | 28% | 31% |
| Better food and cake | 18% | 17% | 16% | 15% | 12% |
How do birthday wants change between ages 3 and 12?
The desire for more activities stays remarkably stable as kids grow, but everything else shifts.
For the youngest kids (ages 2–5), having a favorite character or performer show up is a big deal — 21% of parents flagged this, roughly double the rate of older kids. At that age, a familiar character is the magic.
By ages 6–9, the prime birthday-party window, kids start wanting a bigger stage. Nearly 30% of parents in this group said a different or bigger location would be the top improvement. Friend groups are expanding, opinions are getting louder, and the living room feels small.
Then something distinctive happens at ages 10–12: the social dimension takes over. "More friends and family" spikes to 30% — the highest of any age group — and demand for personalized gifts jumps to 22%. These kids are socially aware. Having the right people there, and feeling individually recognized, matters more than where the party happens.
Source: Chuck E. Cheese Birthday Celebration Study, 2026. Age groups reflect child's age at most recent birthday party.
| Improvement | Ages 2–5 | Ages 6–9 | Ages 10–12 |
|---|---|---|---|
| More games and activities | 33% | 35% | 32% |
| Theme or decorations | 24% | 22% | 20% |
| Bigger or different location | 22% | 30% | 26% |
| More friends and family | 20% | 23% | 30% |
| Favorite character or performer | 21% | 10% | 8% |
| More personalized gifts | 12% | 15% | 22% |
| Better food and cake | 14% | 15% | 16% |
| Longer party time | 13% | 14% | 16% |
Do moms and dads agree on what their kid's birthday needs?
One of the more surprising splits in the data is between moms and dads.
Moms of boys are the single most activity-focused segment in the study: 37% said more games and activities would be the top improvement. Moms of girls lean harder into themes and decorations — 26% vs. 21% for moms of boys.
Dads tell a different story. Dads of girls are the most likely of any parent segment to want a bigger or different location (32%), and dads across the board are more likely than moms to say they want longer party time (17–18% vs. 13–14%). Whether that reflects a desire to get more value out of the booking or just to enjoy the chaos a little longer is a household-level debate the data can't settle.
Source: Chuck E. Cheese Birthday Celebration Study, 2026. Segments by parent gender × child gender. Top improvements shown.
| Improvement | Mom of Boy | Mom of Girl | Dad of Boy | Dad of Girl | Overall |
|---|---|---|---|---|---|
| More games and activities | 37% | 32% | 34% | 31% | 34% |
| Theme or decorations | 21% | 26% | 22% | 23% | 23% |
| Bigger or different location | 26% | 27% | 28% | 32% | 28% |
| Longer party time | 13% | 14% | 17% | 18% | 15% |
What's the social factor most parents miss?
The most counterintuitive finding in this study comes from how parents describe their child's social style.
For kids with large friend groups, parents focus on the experience — more activities, better locations, themes that impress a crowd. But for kids with a smaller circle of friends, 27% of parents said simply inviting more people would be the biggest improvement, compared to 23% for the big-group kids.
For some children, the best birthday upgrade isn't a better venue or a fancier cake. It's a fuller room. Parents who've considered or used a structured-party venue understand this instinctively — they were significantly more likely than average to say that inviting more friends and family would make the biggest difference (31% vs. 25% overall).
How do birthday priorities differ around the world?
Birthday culture varies more than expected. In Japan, 58% of parents said better food and cake options would improve the party — nearly four times the global average. In East Asia broadly, only 7% care about a bigger location, compared to 28% globally. Parties there are intimate by design.
The reverse pattern shows up in Latin America: in Guatemala, the desire for a bigger location hits 45% — the highest of any country in the study. And in Puerto Rico, 47% of parents want more activities, the single highest country-level response for that question anywhere in the data.
What connects all of it: regardless of geography or culture, parents everywhere are trying to give their kid a birthday that feels special to that kid. The specifics vary; the motivation doesn't.
Source: Chuck E. Cheese Birthday Celebration Study, 2026. Markets with n≥100 shown. Top 3 improvements by global rank.
| Country / Market | More Activities | Theme / Decorations | Bigger Location | Better Food & Cake |
|---|---|---|---|---|
| Overall (Global) | 34% | 23% | 28% | 15% |
| United States | 35% | 24% | 27% | 14% |
| Puerto Rico | 47% | 21% | 30% | 12% |
| Guatemala | 36% | 22% | 45% | 13% |
| Mexico | 33% | 25% | 38% | 16% |
| Colombia | 34% | 23% | 36% | 14% |
| Japan | 18% | 15% | 7% | 58% |
| East Asia (excl. Japan) | 22% | 19% | 7% | 42% |
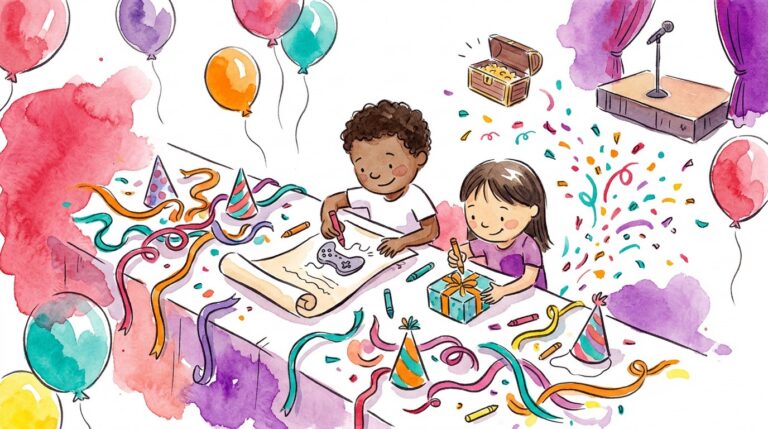
What does this mean for planning your kid's next party?
If you're planning a birthday and wondering where to put your time and budget, the data points to a clear priority order. Start with activities — make sure there's plenty to do. Then focus on the guest list, especially as your child gets older. Save the theme and decorations for last. They add polish; they're not the foundation.
The families who throw the highest-rated parties in this study aren't the ones who spent the most on decorations. They're the ones who made sure the kids never stopped moving, laughing, and playing together.
Study Methodology and Limitations
About This Research
Study: Chuck E. Cheese Birthday Celebration Study, 2026. Conducted and published by the Chuck E. Cheese Birthday Research Center.
Sample: 4,985 parents of children ages 2–12, fielded across 25+ countries. Markets with n≥100 are reported individually; smaller markets are grouped regionally.
Method: Online survey. Parents were asked to identify the single change that would have made their child's most recent birthday party better, selecting from a structured list.
Proxy-reporting caveat: All responses reflect parent perceptions of what their child wants or would have benefited from — not direct responses from children. Stated parental preferences may differ from children's revealed preferences in observed party settings.
Single-answer design: Because respondents chose one improvement, the percentage totals reflect relative priority, not frequency of all desired improvements simultaneously. A parent who selects "more activities" may also value a better venue; the data captures only first-priority ranking.
Limitations: Geographic coverage is uneven — sample sizes vary significantly by market, and results from smaller markets should be interpreted directionally. The study does not capture party cost, planning time, or the relative influence of children vs. parents in party decision-making. Results may not generalize to populations outside the study markets or to party types not represented in the sample (e.g., school-based parties, religious celebrations). See full methodology at the Birthday Research Center →
Frequently asked questions
-
What's the most-requested improvement to a kid's birthday party?
More games and activities — by a wide margin. 34% of parents in this study of nearly 5,000 said more activities would have made their child's last birthday party better. Theme and decorations came in well behind at 23%, even though that's where most parents spend their planning energy.
-
What do younger kids (ages 2–5) want most at a birthday party?
A familiar character or performer matters disproportionately at this age — 21% of parents of toddlers and preschoolers flagged this, roughly double the rate of older kids. For young children, a beloved character is itself the experience. After that, more activities and parental presence are the next most-cited improvements.
-
What do older kids (ages 10–12) want most at a birthday party?
The social factor takes over. 30% of parents of 10–12-year-olds said "more friends and family" would be the top improvement — the highest of any age group. Demand for personalized gifts also rises to 22%. At this age, who's there matters more than where the party is or what it looks like.
-
Do moms and dads want different things from a kid's birthday party?
Yes — and the split is sharper than expected. Moms of boys are the most activity-focused segment in the study (37% want more activities). Moms of girls lean toward themes and decorations (26%). Dads of girls are the most likely to want a bigger location (32%), and dads overall are more likely than moms to want longer party time. The data doesn't settle the debate; it just shows the gap.
-
Should I spend more on decorations or on activities?
Activities. The data is clear and consistent: parents who gave their kid's last birthday a perfect rating were significantly more likely to have prioritized activities and the social experience over aesthetics. Parents who rated the party poorly were more likely to wish the food or duration had been better. Decorations add polish, but they're not what kids remember.
-
What if my kid has a small group of close friends rather than a big crowd?
The best upgrade in that case is often more guests — not a better venue. Among parents of kids with smaller friend circles, 27% said simply inviting more people would be the biggest improvement, vs. 23% for parents of kids with large friend groups. For some children, a fuller room is itself the gift.
-
Why does birthday party food matter so much more in Japan than everywhere else?
58% of parents in Japan said better food and cake options would be the top improvement — nearly four times the global average of 15%. This reflects a broader cultural emphasis on food presentation and ritual in Japanese celebration contexts. East Asia broadly shows a similar (though less extreme) pattern, with food and cake ranking far higher than in Western or Latin American markets. The data does not identify why this divergence exists — only that it is the largest country-level outlier in the study on any single response option.
-
How was this birthday party research conducted?
The Chuck E. Cheese Birthday Celebration Study surveyed 4,985 parents of children ages 2–12 across 25+ countries in 2026. Parents were asked to identify the single improvement that would have made their child's most recent birthday party better. All responses represent parent perceptions — not direct responses from children. Single-answer design means results reflect relative priority rather than all desired improvements simultaneously. Full methodology is published at the Birthday Research Center.
-
What does this research not cover?
This study has several intentional limitations worth noting. It captures parent perceptions, not direct child responses — so stated preferences may differ from what children would choose themselves. It does not measure party cost, planning time, or the specific influence children vs. parents have in party decisions. Geographic coverage is uneven; markets with smaller sample sizes (under 100 parents) are grouped regionally rather than reported individually. The study also does not cover school-based parties, religious celebrations, or party formats outside the mainstream types represented in the sample.
Other studies in this series
You Came for the Goals. Stay for the Cheese. | Chuck E. Cheese
Chuck E. Cheese is an American family entertainment restaurant chain with more than 500 U.S. locations combining pizza, arcade games and indoor…
July 2026
Do Families Limit the Number of Kids at a Birthday Party? | Chuck E. Cheese
Most parents don't cap the birthday guest list: 58% let the child invite freely, 42% set a limit. Among limiters, keeping it…
June 2026
What Would Make Your Child’s Next Birthday Even Better Than the Last? | Chuck E. Cheese
Parents say more games (34%) and a bigger venue (28%) would have improved their child's last birthday. Better food and cake ranked…
May 2026